We are extremely EXCITED here at HookLogic.
Why? Because over the last year we have been working to "Build the Ultimate Attribution Model" for Auto Dealers.
By diligently working with RL Polk, we have developed a monthly Purchase Analysis Report to complement our existing reporting suite.
You already know our weekly performance report that breaks down your lead and show ratios. Many of us on the HookLogic team have spent several years in the business and know that you are wondering ‘But do I sell cars using HookLogic’. Now we provide the answer. By providing sales data, not just with our dealers, but with surrounding dealers as well, you will see your true HookLogic ROI as well as lost opportunities.
Let’s review our new Purchase Analysis Report:
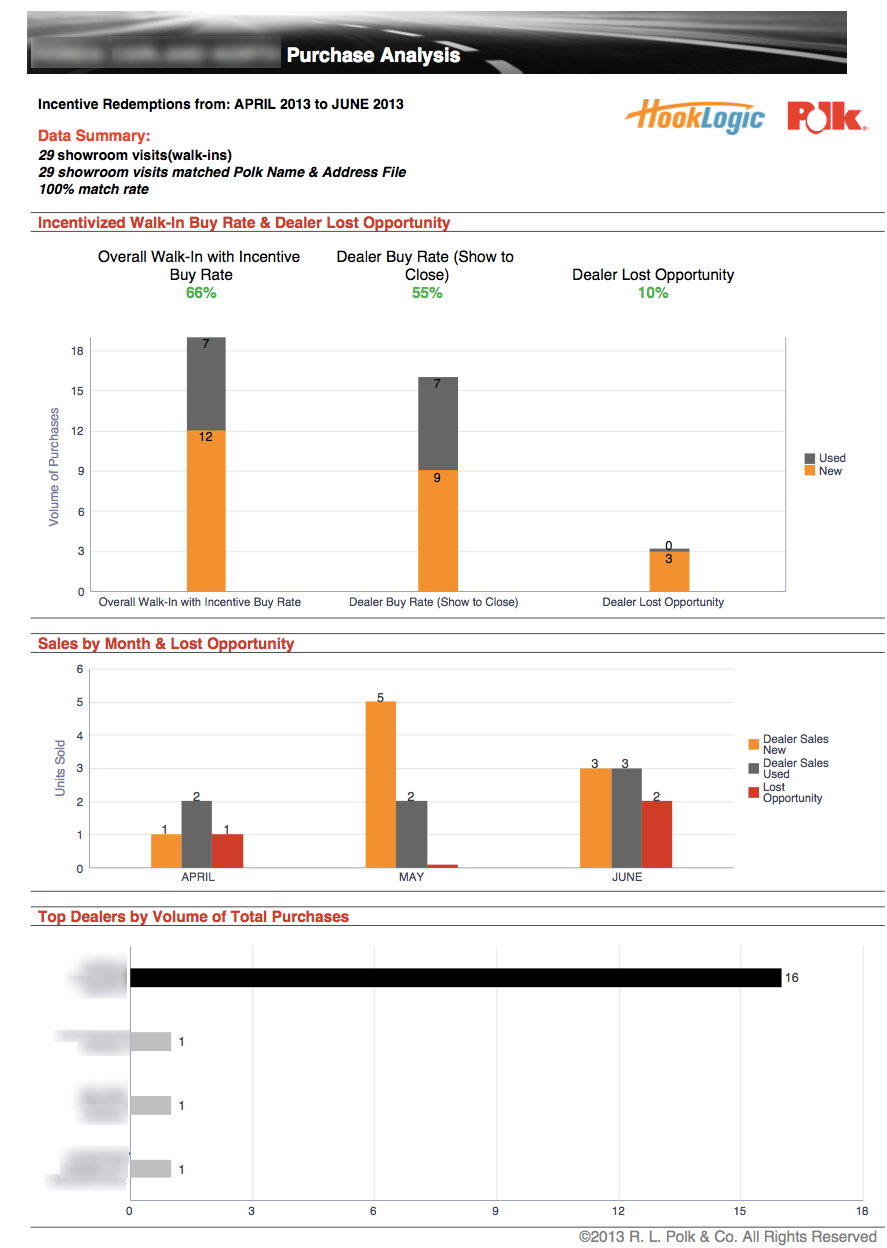
In the example Purchase Analysis Report, we are able to match nearly every showroom visit into the dealership that resulted in a sale (29). This is found under the Data Summary in the top left portion of the report.
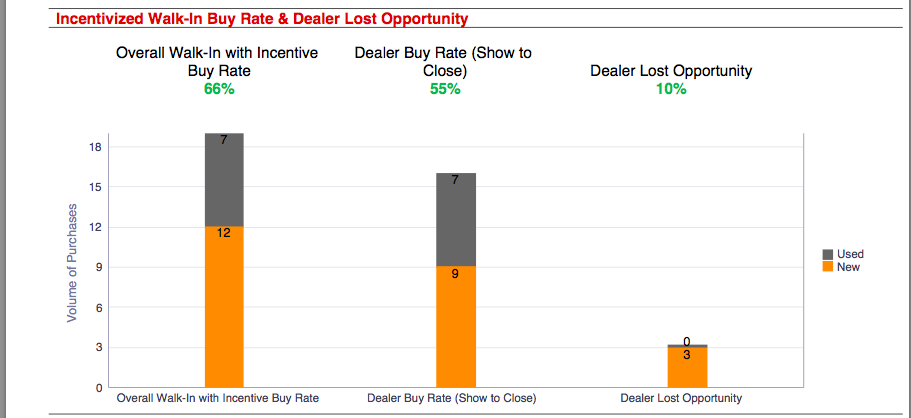
The first bar chart you see is the Overall Walk-in with Incentive Buy-Rate (66%). This is the percentage of overall customers that were incentivized with HookLogic that resulted in a sale during a 90 day period.
Important to note here - this is the OVERALL Incentive Buy-Rate. Meaning that, these matched customers bought a car, somewhere.
The next bar chart is your Dealer Buy Rate or what we like to call, your Show to Close. In this example, the dealership Sold 16 of the 29 opportunities (customers that walked into the dealership), resulting in a 55% Dealer Buy Rate, or show to close percentage.
Next up is your Dealer Lost Opportunity. These are the customers that HookLogic incentivized to show up at your dealership to buy a vehicle, but walked out of your showroom without making a purchase and then went to another dealership.

In this example you see this dealership lost 3 sales to a competitor. Not only does this report show you the number of lost sales, but at the bottom of the report, you will see which 3 dealers they lost the sale too. Not only did they lose 3 sales BUT these customers bought what they intended to purchase.
Compelling isn’t it?
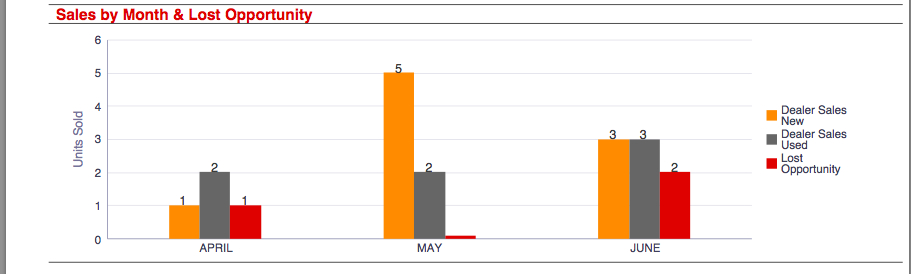
The middle performance bar charts includes the same information but broken out into the last 3 months by New, Used and Lost Opportunities.
We are confident these new Purchase Analysis Report will close the loop on the sale and help HookLogic and you create the ultimate attribution model.
If at anytime you have ANY questions about this report, please contact our support team and we will schedule a time to review. We want you to have a complete understanding of these reports.
Thanks for taking your time to read this; which hopefully has opened your eyes to the value HookLogic provides.